10 Vital Steps To Crypto Market Depth Analysis
Unlock the Secrets of crypto market depth analysis - Dive into comprehensive insights, trends, and strategies to navigate the volatile world of cryptocurrency.
Author:Stefano MclaughlinReviewer:Camilo WoodFeb 27, 20242K Shares27.3K Views
This is the comprehensive guide to crypto market depth analysis,which is the ability of the market to withstand relatively big market orders without affecting the asset's price is known as market depth.
Market depth is determined by counting the number of buy and sell orders at different price points on each side of the mid-price, taking into account the total level and breadth of open orders. The "Volume at Stake," or the order volume listed on an exchange's order book with a non-negligible chance of being executed as a trade, is indicated by the market depth for a particular pair.
10 Vital Steps
Navigating the crypto market effectively requires in-depth analysis beyond just price charts. Here are 10 crucial steps to incorporate into your depth analysis:
1. Understand Order Book Dynamics
- Analyze the buy and sell orders at various price levels (bid-ask spread) to gauge market sentiment and potential support/resistance.
- Identify large orders that could significantly impact price movements.
2. Utilize Liquidity Metrics
- Assess market liquidity through metrics like order book depth, trading volume, and exchange activity.
- Higher liquidity generally indicates smoother price movements and lower volatility.
3. Employ Technical Analysis
- Integrate tools like moving averages, Bollinger Bands, and Relative Strength Index (RSI) to identify trends, potential reversal points, and overbought/oversold conditions.
- Remember, technical indicators are not foolproof and should be used in conjunction with other analysis.
4. Dive Into Fundamental Analysis
- Research project whitepapers, roadmaps, team backgrounds, and adoption rates to understand a coin's underlying value proposition and future potential.
- Assess the overall health of the cryptocurrency ecosystem and relevant market trends.
5. Track On-Chain Data
- Analyze on-chain data like active addresses, transaction volume, and whale movements to gain insights into network usage and investor behavior.
- Platforms like Glassnodeand Messari offer valuable on-chain data tools.
6. Monitor Social Media Buzz
- Track community sentiment and news mentions on platforms like Twitter, Telegram, and Reddit to gauge public interest and potential hype.
- Be mindful of misinformation and filter out unreliable sources.
7. Consider Macroeconomic Factors
- Understand how global economic events, interest rates, and regulations can impact the overall crypto market and individual coins.
- Stay informed about potential upcoming events that could influence market sentiment.
8. Analyze Funding Rates
- Explore perpetual futures funding rates to assess market sentiment towards a specific coin.
- Positive funding rates indicate bullishness, while negative rates suggest bearishness.
9. Look Beyond Market Cap
While market cap is a widely used metric, consider alternative metrics like network value to transaction volume (NVT) ratio for a more nuanced understanding of a coin's value.
10. Backtest & Refine Your Strategy
- Test your analysis methods on historical data to assess their effectiveness.
- Continuously learn and adapt your strategies based on market evolution and your own experience.
What Is Market Depth Chart And How To Calculate It?
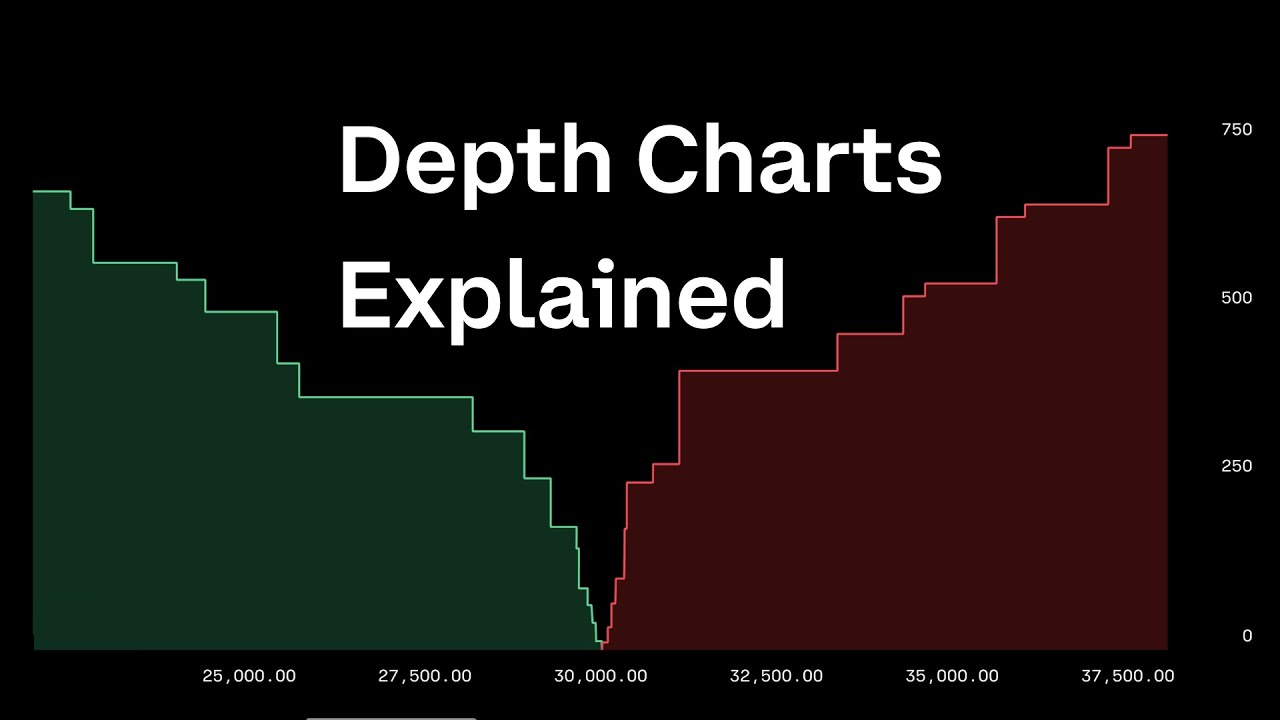
A market depth chart visually represents the supply and demand dynamics for a cryptocurrency across various price levels. It offers insight into the density of both buy and sell orders present in the order book, serving as a graphical depiction of market activity.
Essentially, the market depth chart mirrors the order book, illustrating the distribution of limit buy and sell orders. On the chart, buy orders are depicted on the left side in green, while sell orders are shown on the right side in red.
The accumulation of buy orders forms a "buy wall," whereas the collection of sell orders creates a "sell wall." Notably, the midpoint on the chart corresponds to the current market price of the cryptocurrency.
The chart's horizontal axis delineates the price range of outstanding limit orders, with prices increasing from left to right. Meanwhile, the vertical axis reflects the cumulative value of orders at each price level.
Calculation
The cumulative volume of the base asset at different percentages from the mid price is all that is needed to calculate market depth. For instance, the volume of all bids for Bitcoin that fall within 10% of the mid price at which the order book snapshot was recorded is represented as the "Bid Volume 10%" for BTC/USD on Coinbase.
We would total the volume of all offers made within this 10% price range in order to determine the depth. On the other hand, the volume of all requests made within 10% of the mid-price would be the "Ask Volume 10%."
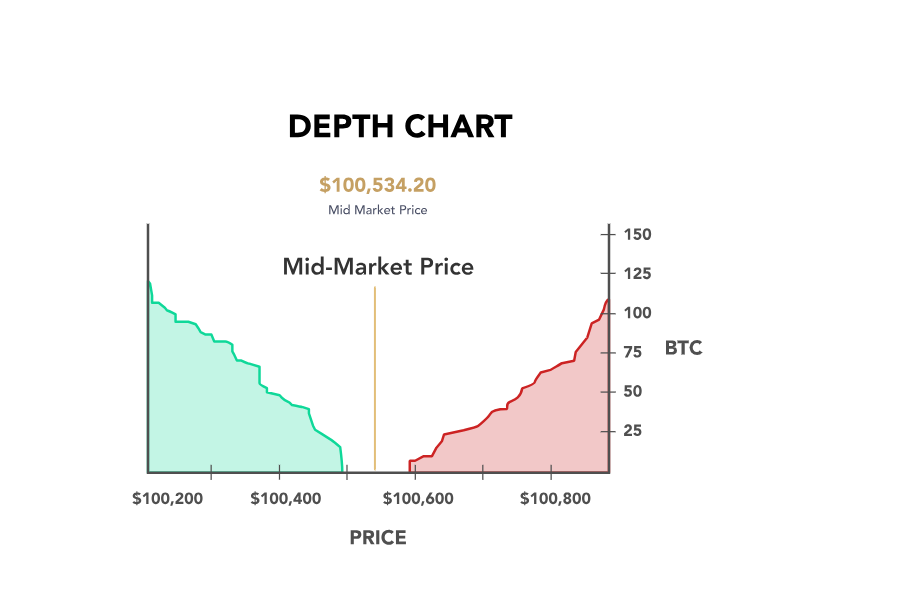
Monitoring Supply And Demand Via The Depth Chart
As depicted in the chart above, the buy wall ascends as the price declines, indicating a surge in demand as prices decrease. This suggests that traders anticipate sufficient demand at lower prices, thereby preventing the market price from dropping below those levels.
Conversely, the sell wall elevates as prices rise, signifying an increase in supply as prices escalate. A substantial sell wall implies traders' confidence in the availability of ample supply, thereby capping the market price from surpassing those levels.
Why Is Understanding A Depth Chart Important?
People opt to either hold bitcoin for long-term investment purposes or participate in trading activities. A depth chart serves as a valuable tool for comprehending the supply and demand dynamics of Bitcoin at specific instances across a spectrum of prices.
It functions as a graphical portrayal of an order book, which encompasses the outstanding buy or sell orders of an asset at different price tiers. For individuals interested in trading, acquiring the skill to interpret a Bitcoin depth chart is crucial for gaining insights into the market.
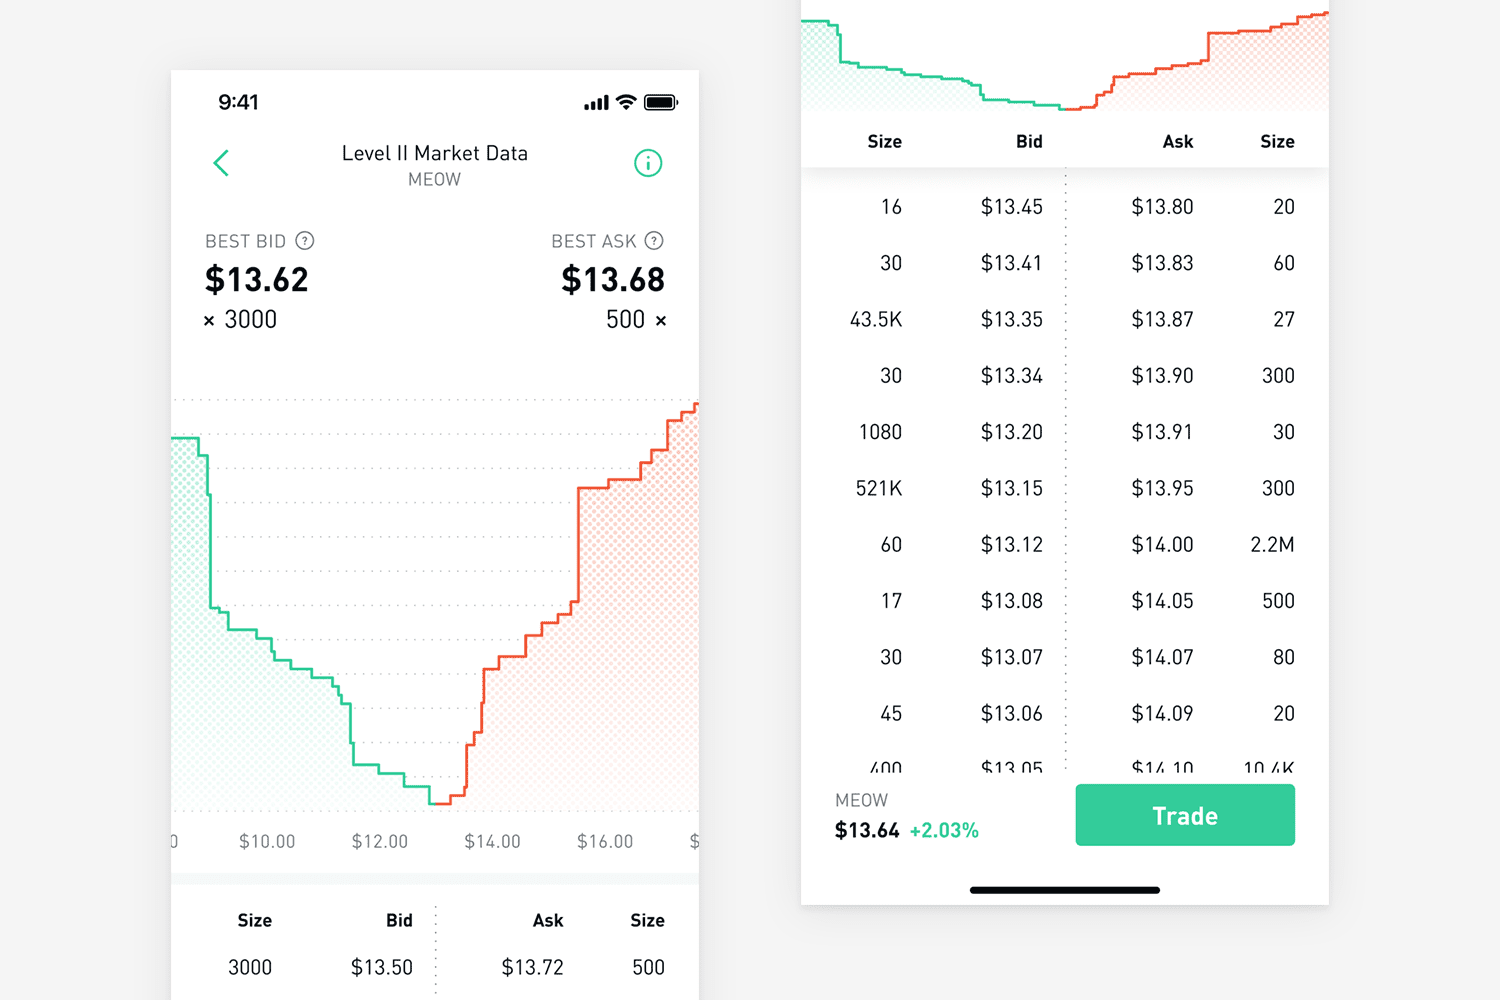
The Components Of A Depth Chart
Understanding the chart's components is essential to reading a depth chart. Although depth charts differ between exchanges, a typical Bitcoin depth chart consists of the following essential elements:
1. Bid Line
The cumulative value of the bids, or buy orders, at a specific Bitcoin price point is shown in the bid line. A green line that slopes negatively from left to right serves as its representation. Purchase orders are made with dollars or other fiat money.
2. Ask Line
The total value of the asks, or sell orders, at each price point is shown by the ask line. A red line that slopes negatively from right to left depicts it. Orders for sales are made in bitcoin.
3. Horizontal axis
the prices at which orders to buy and sell are placed.
4. Vertical axis
The total amount of money that all put orders to sell bitcoin for. On the left vertical axis, all buy orders' total dollar value is displayed.
What Are The Disadvantages Of The “market Depth” Tool For Analyzing Cryptocurrencies?
Let us now delineate the drawbacks of this instrument:
1. Intricacy -At first glance, the depth chart appears unwieldy and complex. The concepts of the order book and the dynamics of the market must be understood in order to correctly interpret information.
2. Transient volatility -Since DoM shows real-time data, the chart data may be highly erratic and subject to sudden changes. It is so challenging to decide whether to open or close a trade accurately and promptly.
3. Potential for manipulation -Large orders can be placed by "whales," or major market participants, to sway sentiment or create a false sense of supply and demand.
4. Little historical information -In a little amount of time, depth research typically provides an indication of the market's current condition.
5. Lack of context- Although the DoM chart offers useful insights into the order book's current condition, it lacks the large picture and fundamental data that could influence price movement.
Market depth is still one of the instruments for sophisticated research because of its capabilities and the availability of alternative techniques for studying crypto assets. It is only used to evaluate the state of the market in a brief amount of time and cannot give a comprehensive picture of current conditions on its own.
For this reason, you must always adhere to your trading plan: thoroughly inspect assets, use tools (such market depth) to study their price chart, and base judgments on information rather than feelings. Remember to manage hazards as well!
FAQ's About Crypto Market Depth Analysis
What Is 2% Depth In Crypto?
The term "+2% depth" describes a feature that shows the order book depth for a certain trading pair on cryptocurrency exchange platforms. To put it another way, it displays the quantity of buy and sell orders that are placed inside a 2% range of the current market price.
How Do You Analyze Market Depth?
The order book of a securities, which is a list of pending orders to purchase or sell at different price points, can be used to assess market depth. Even for stocks with the largest daily volumes, there could be a substantial enough imbalance of orders on any particular day to cause significant volatility.
What Is The Depth Of A Crypto Exchange?
Because order book depth offers important insights about the liquidity of the market and the possible price movements of a cryptocurrency, it is an essential component of trading. The quantity of buy and sell orders at various price points is referred to as the order book's depth.
Conclusion
Delving into crypto market depth analysis unveils a wealth of insights crucial for navigating the dynamic landscape of digital assets. Through the meticulous examination of order book data and the interpretation of buy and sell orders at varying price levels, traders gain a deeper understanding of market sentiment and liquidity dynamics.
Armed with this knowledge, investors can make more informed decisions, identify optimal entry and exit points, and effectively manage risks in the volatile cryptocurrency markets.
Jump to
10 Vital Steps
What Is Market Depth Chart And How To Calculate It?
Monitoring Supply And Demand Via The Depth Chart
Why Is Understanding A Depth Chart Important?
The Components Of A Depth Chart
What Are The Disadvantages Of The “market Depth” Tool For Analyzing Cryptocurrencies?
FAQ's About Crypto Market Depth Analysis
Conclusion

Stefano Mclaughlin
Author

Camilo Wood
Reviewer
Latest Articles
Popular Articles