The Fed Discussing and Dismissing the Housing Bubble in 2004
The Federal Reserve releases minutes of its meetings discussing monetary policy and reviewing risks to the economy on a six-year delay, and last week it
Jul 31, 2020105.3K Shares1.8M Views
The Federal Reserve releasesminutes of its meetings discussing monetary policy and reviewing risks to the economy on a six-year delay, and last week it released its data from 2004 — the year that housing economists first started really ringing the alarm bell about the risk of a housing bubble. These early bubble-callers often pointed to the clear distortion in the rent ratio, or the price of the home divided by the cost to rent it for a year, as a sign of a market gone awry. Generally, homes cost on average 15 or 20 times the cost to rent them. But starting in the late 1990s, the cost of buying a home started to seriously outpace the cost of renting.
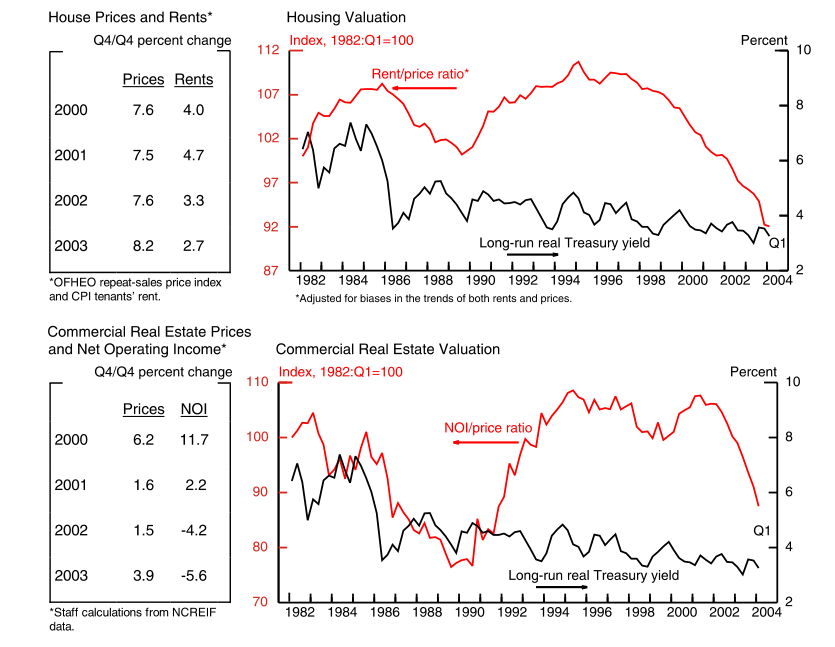
In 2004, the Fed board discussed the possibility of a housing bubble intermittently, usually for just a few sentences at a time. But in June, it looked at a rent ratio graph and discussed it at length. Here it is, with the upper chart showing housing and the lower chart showing commercial real estate, and the red line the one to watch:
“„MS. BIES. I have a question on chart 3 on the commercial real estate valuation. Having lived through the 1986-91 period when the [net operating income]-price ratio was down to the levels it is today, I look at that period as abnormal because we had tax changes that were retroactive, which basically put a lot of real estate projects and ownership under water. So we had a tremendous upheaval in the real estate market, with people filing for bankruptcy and dumping properties. It worries me that we’re back down in a sense to a situation that is comparable to that severe turn in the real estate market.I really look at that as a good example of how retroactive taxes affect people’s return targets when they enter into long-lived projects.
“„MR. OLINER. I was actually here at the Board during that period, and I remember that we were concerned as well in the late ’80s about real estate valuations and the amount of construction still going on given that the tax benefits had been withdrawn in 1986. We did not really understand what the rationale was in the market. Ultimately it turned out that there was a massive amount of over-construction and lending standards that were too lax. I think there are some reasons to be watchful of developments in the commercial construction sector at this point. It is clear that the compensation for risk has gotten somewhat thinner in this market than it was throughout the 1990s, presumably after market participants had learned some lessons from the very thin compensation that they accepted through the ’80s. On the other hand, we do see some rather substantial differences in the structure of the commercial real estate market at this time. Lending standards do seem to have held much firmer. And there’s a lot more transparency in the market now because of the more widespread availability of data on prices and rents to market participants. So we think the decisionmaking is better.I wouldn’t say it is perfect. We do feel that there is some reason to be alert to developments in that market.
“„CHAIRMAN GREENSPAN. President Lacker.
“„MR. LACKER. Just to follow up on what Roger was asking about the panel in chart 3 on housing valuations. In that panel the relative movement of the two measures is somewhat key to at least the intuitive persuasiveness of the argument that housing might be overvalued. I understand the units of the real long-term Treasury yield. I don’t understand the units of the rent-to-price ratio.
“„MR. OLINER. The rent and the price data come from different sources; they are not part of an integrated system. The rent data are from the CPI, which is itself only an index number. So there is no way to say the rent-price ratio is 8 percent — like an earnings-price ratio, for example.
A quick note here. It is true that the data for renting and buying do come from different sources, but the rent ratio is hardly an obscure and unreliable statistic.
“„CHAIRMAN GREENSPAN. It is proportional to whatever that number would be.
“„MR. OLINER. Yes. We could make the level of the red line anything we wanted to, but we could only move it in a level adjustment up and down.
“„MR. LACKER. But you set the scale, too, right? You could set it so that the zeroes are the same on both axes?
“„MR. OLINER. Right. With creative charting we could make the relationship between the two series shift up and down however we wanted. That’s why we’re stressing –
“„CHAIRMAN GREENSPAN. **But that’s not so for the ratio between those two series. That is invariant to the scale. **
“„MR. LACKER. Yes, that’s true; they ought to have the same zeroes it seems.
“„CHAIRMAN GREENSPAN. No, no. If you have a relative measure that is an actual ratio, the ratio of the two numbers is invariant to what the relative number is.
“„MR. LACKER. That’s right. But in the chart, the staff has the zero set at very different places on the two scales.
“„CHAIRMAN GREENSPAN. You can’t trust them to do it right! [Laughter]
“„MR. LACKER. I’m just wondering, how did you decide where to put the zero? If you put it much closer to where the zero is for the long-run Treasury rate, the squiggles in the red line would be a lot smaller.
“„MR. OLINER. You can make the squiggles as small or as large as you want.
“„MR. LACKER. Right. And your argument has to do with the size of the squiggles?
“„MR. OLINER. No, I think the argument has to do with the size of the gap between the two. And the current gap relative to its average over history.
“„CHAIRMAN GREENSPAN. The scale will not change the fact that the gap is closing. The conclusion is independent of the scale. You could try any variation you want, and that gap will always close.
“„MR. LACKER. The gap between these two lines?
“„CHAIRMAN GREENSPAN. Yes.
“„MR. OLINER. No matter what we used for our charting convention, the gap would be relatively narrow now compared with its historical average.
“„CHAIRMAN GREENSPAN. Just take the ratio of the two ratios.
Confused? You should be.
The various Fed members are talking past one another about the construction of the graphs, rather than delving into their meaning. To be fair, the visuals are unusually constructed. The rent ratio is generally given — again — as the price of the home divided by the cost to rent it for a year. Their metric appears to be the annual cost of rental divided by the cost of the home. (Regardless, it shows a historical anomaly, with that red line on the upper graph suddenly diving.) Additionally, they chart their rent ratio against long-term Treasury yields, and spend more time discussing the relationship between the two than the anomaly of the rent ratio itself.
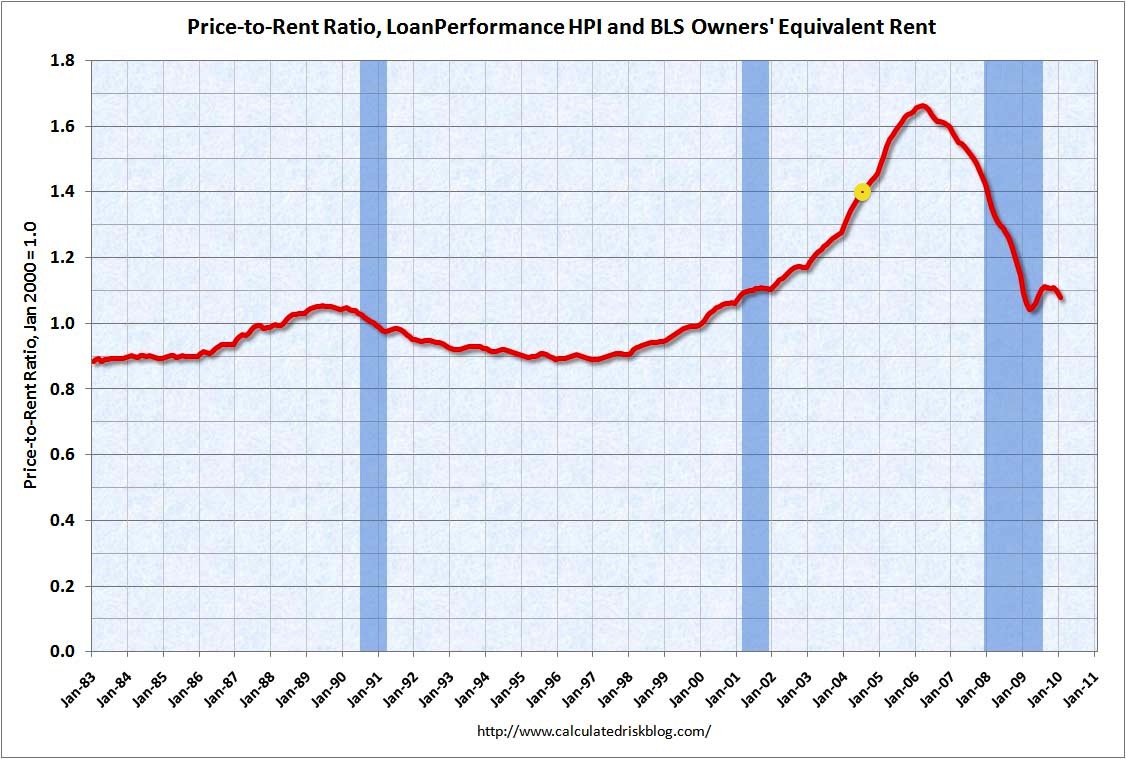
Were they to look at a simpler chart, it would be hard not to see something strange going on. Here is a standard rent ratio chart, which I took from Calculated Risk, with the yellow dot representing the time of the Fed meeting.
The anomalous upward shift is clear. And the Fed’s own economists notedit in a detailed note warning of a housing bubble just three months later.
Of course, hindsight is 20/20. The Fed governors in the minutes repeatedly point to good economic fundamentals stoking housing prices, rather than irrational exuberance, a credit bubble and the growth of real-estate flipping. But in this instance, the Fed willfully dismisses and misinterprets its own data. It reminds me of a passage from Carmen Reinhardt and Kenneth Rogoff’s “This Time It’s Different.”
“„The most significant hurdle in establishing an effective and credible early warning system … is not the design of a systematic framework that is capable of producing relatively reliable signals of distress from the various indicators in a timely manner. The greatest barrier to success is the well-entrenched tendency of policy makers and market participants to treat the signals as irrelevant archaic residuals of an outdated framework, assuming that old rules of valuation no longer apply.

Rhyley Carney
Reviewer
Latest Articles
Popular Articles

