State and local governments hired fewer people in September, while total hires and job openings increased
Total job openings in the U.S. economy rose in September, increasing by 225,000 to 3.35 million, and total hires during the month increased by 185,000 to 4.25
Jul 31, 2020240.4K Shares3.3M Views
Total job openings in the U.S. economy rose in September, increasing by 225,000 to 3.35 million, and total hires during the month increased by 185,000 to 4.25 million, according to new estimates from the Bureau of Labor Statistics. But while the number of people getting hired in the U.S. economy increased, government hired fewer people than before.
Total government job hires decreased by 13,000 to 262,000, and state and local governments hires decreased by 14,000 to 233,000, meaning that the drag on hiring from government is being driven at the state and local level.
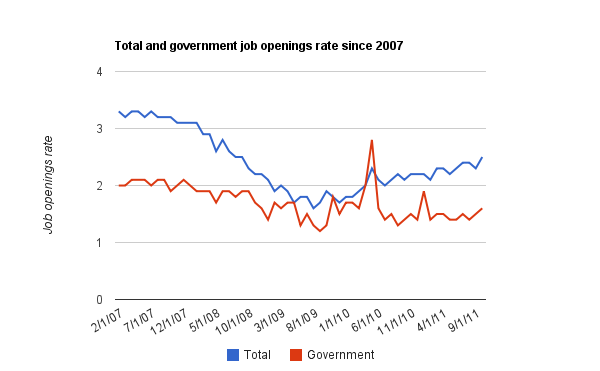
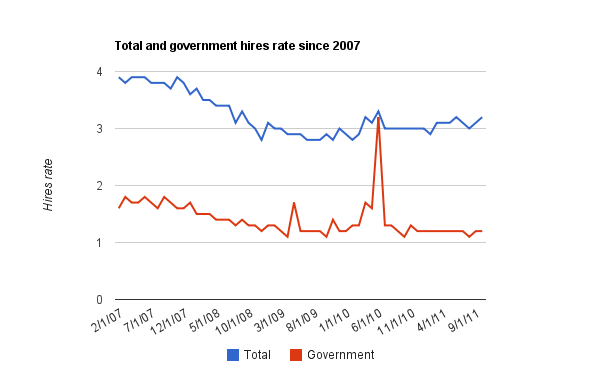
The total job opening rate increased from 2.3 to 2.5 percent (meaning 2.5 percent of existing jobs in the U.S. economy were unfilled at the end of September), which is the highest it’s been since August 2008. The total hires rate increased from 3.1 to 3.2 percent.
However, the rate of state and local government hires decreased from 1.3 to 1.2, even as the job opening rate increased from 1.5 to 1.6.
BLS currently estimates that the number of people employed increased by 158,000 in September, and by 80,000 in October.
Layoffs and firings increased by 69,000 to 1.76 million total in September. Both the private sector and government increased their layoffs and discharges, with private sector layoffs and discharges increasing by 55,000 and government layoffs and discharges increasing by 14,000.
Voluntary quits also rose in September, increasing by 42,000 to 2.05 million total. But the increase was driven by the private sector, where voluntary quits increased by 44,000, and voluntary quits from government jobs decreased by 2,000.
For a better perspective on where the job openings and hires numbers have progressed since the start of the recession, here’s a graph of total and government (federal, state and local) job opening rates since 2007, which shows that total job openings have increased slightly in the past year but haven’t returned to what they were before the recession, even as government job openings have stagnated.
And here’s a graph of total and government hires since 2007, which shows that both total hires and government hires have remained relatively steady.

Rhyley Carney
Reviewer
Latest Articles
Popular Articles